

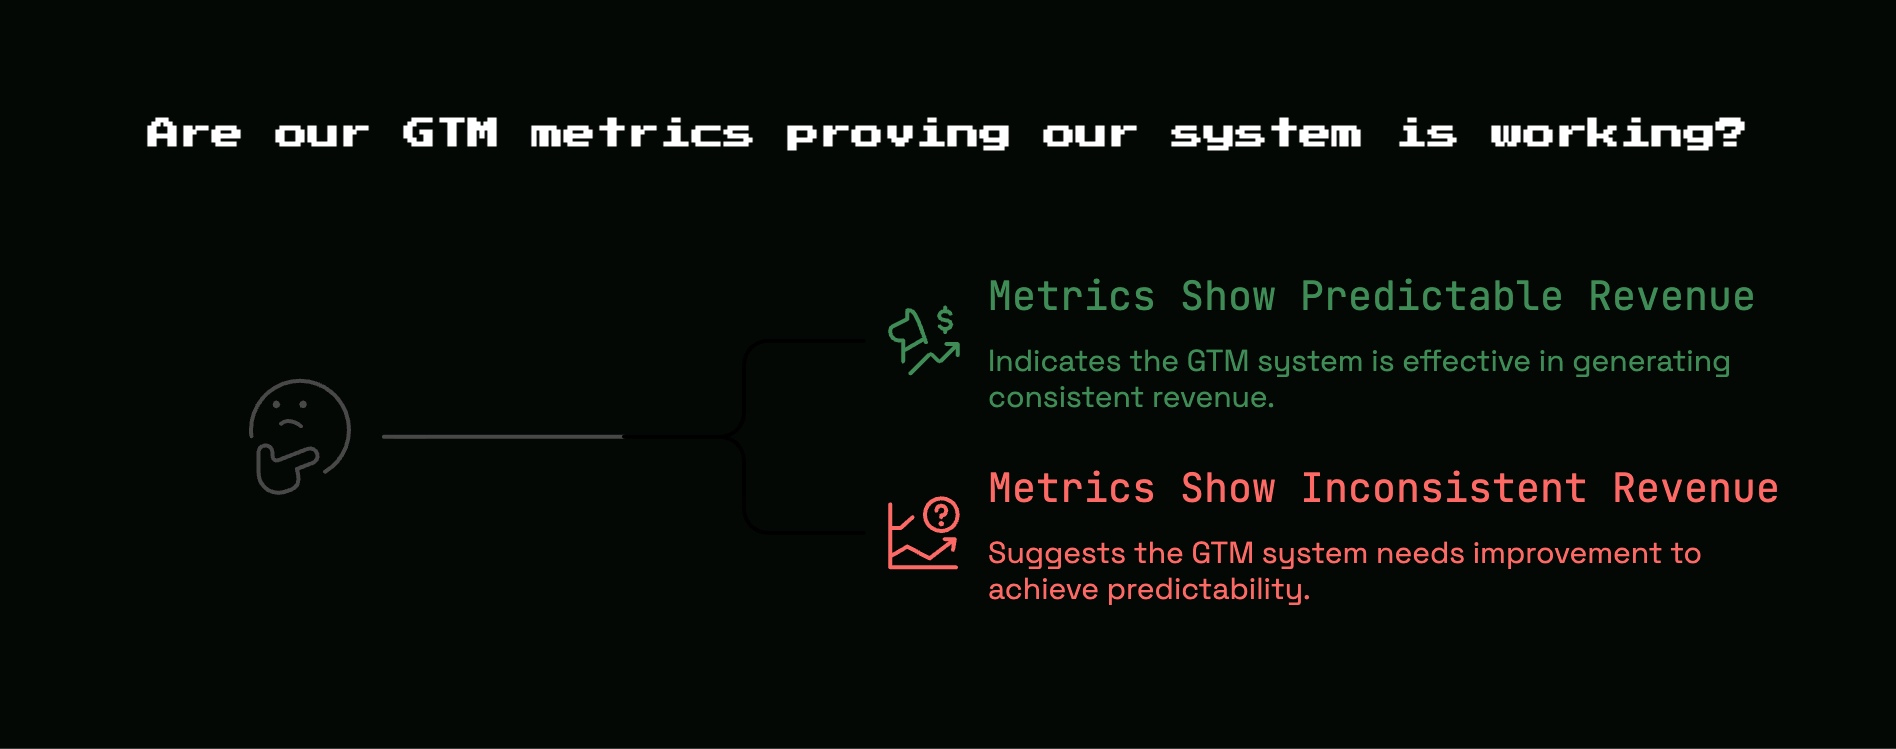
GTM metrics are the numbers that tell you whether your go-to-market system is actually producing predictable revenue, or just keeping everyone busy. If your weeks are full of demos, follow-ups, Slack updates, and dashboard screenshots but revenue still feels shaky, this is the layer that clears up what is working, what is noise, and what needs fixing.
What “GTM metrics” actually means in a SaaS business
GTM here means go-to-market, not Google Tag Manager. In a SaaS business, GTM metrics are the numbers that show whether your way of finding customers, turning interest into deals, and keeping those customers is working as a system.
That last part matters. A system should do more than create motion. It should help you generate revenue with some level of consistency. Not perfect predictability, especially at $1M to $5M ARR, but enough that you can answer basic questions without guessing. Can you afford this channel? Is your first sales rep helping? Are you attracting the right accounts? Are new customers sticking around?
A useful way to think about GTM metrics is this: they are proof of cause and effect. You put time, money, headcount, and tooling into your go-to-market motion. The right metrics show what those inputs are producing on the other side.
The difference between busy metrics and proof
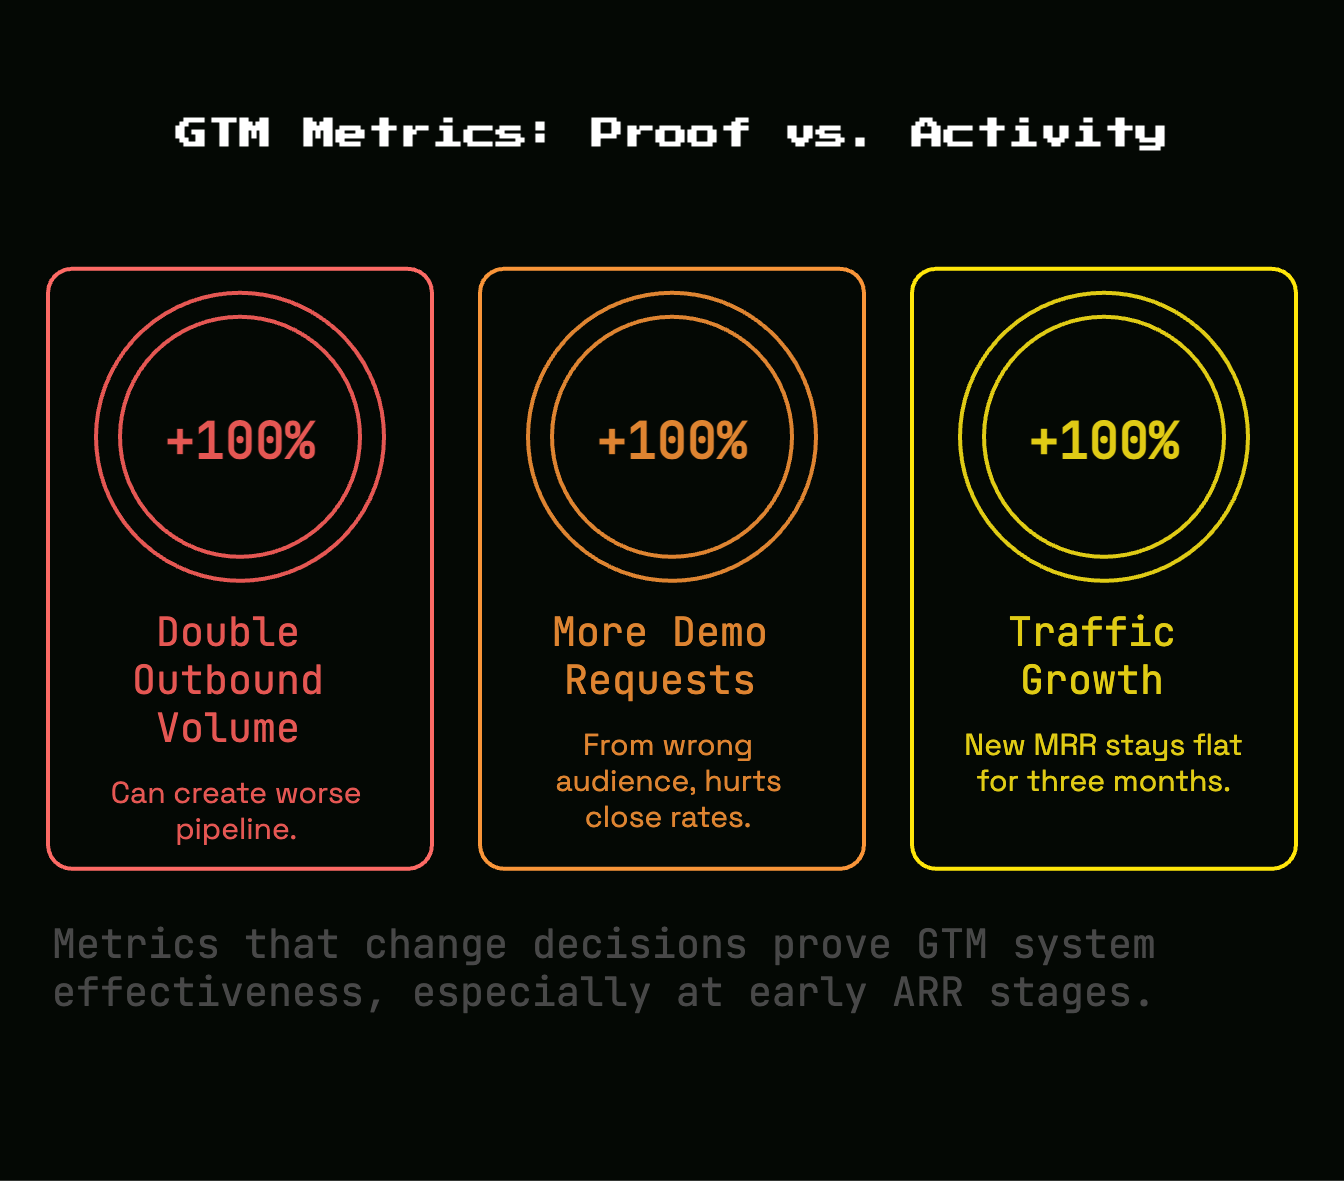
Early teams usually track whatever is easiest to pull from a dashboard. Website sessions. Email opens. Demo requests. Calls made. Meetings booked. Those numbers can be interesting, but vanity metrics do not prove your GTM system works.
Here’s the thing: activity is not the same as progress. You can double outbound volume and create worse pipeline. You can get more demo requests from the wrong audience and hurt close rates. You can celebrate traffic growth while new MRR stays flat for three months.
Proof looks different. Proof connects effort to revenue, and revenue to retention. It shows that the motion is efficient enough to sustain, repeatable enough to hand off, and healthy enough to keep customers after the sale.
A metric proves something only when it changes a decision
A number earns a place on your scorecard when it changes what you do next. If CAC rises, maybe you cut a channel or tighten targeting. If demo-to-opportunity conversion drops, maybe your qualification is off or your messaging is attracting poor-fit accounts. If churn climbs in one segment, maybe that segment should not be a priority anymore.
If a number looks interesting but never affects spend, hiring, targeting, pricing, or process, it is probably not core. That does not make it useless. It just means it belongs in a side view, not at the center of your GTM dashboard.
Why this matters more at $1M, $5M ARR
At this stage, every wrong move is louder.
You probably do not have layers of specialist teams to absorb mistakes. Cash is tighter. Headcount is leaner. One bad hire, one bloated channel, or one quarter spent chasing bad-fit leads can drag harder than it would in a larger company. That is especially true if you are bootstrapped or carefully managing burn.
This is why clean GTM metrics matter more than most people admit. They protect focus. They help you avoid hiring around a broken process. They keep you from confusing “more stuff happening” with “the business is getting stronger.”
The 3 questions your GTM metrics should answer
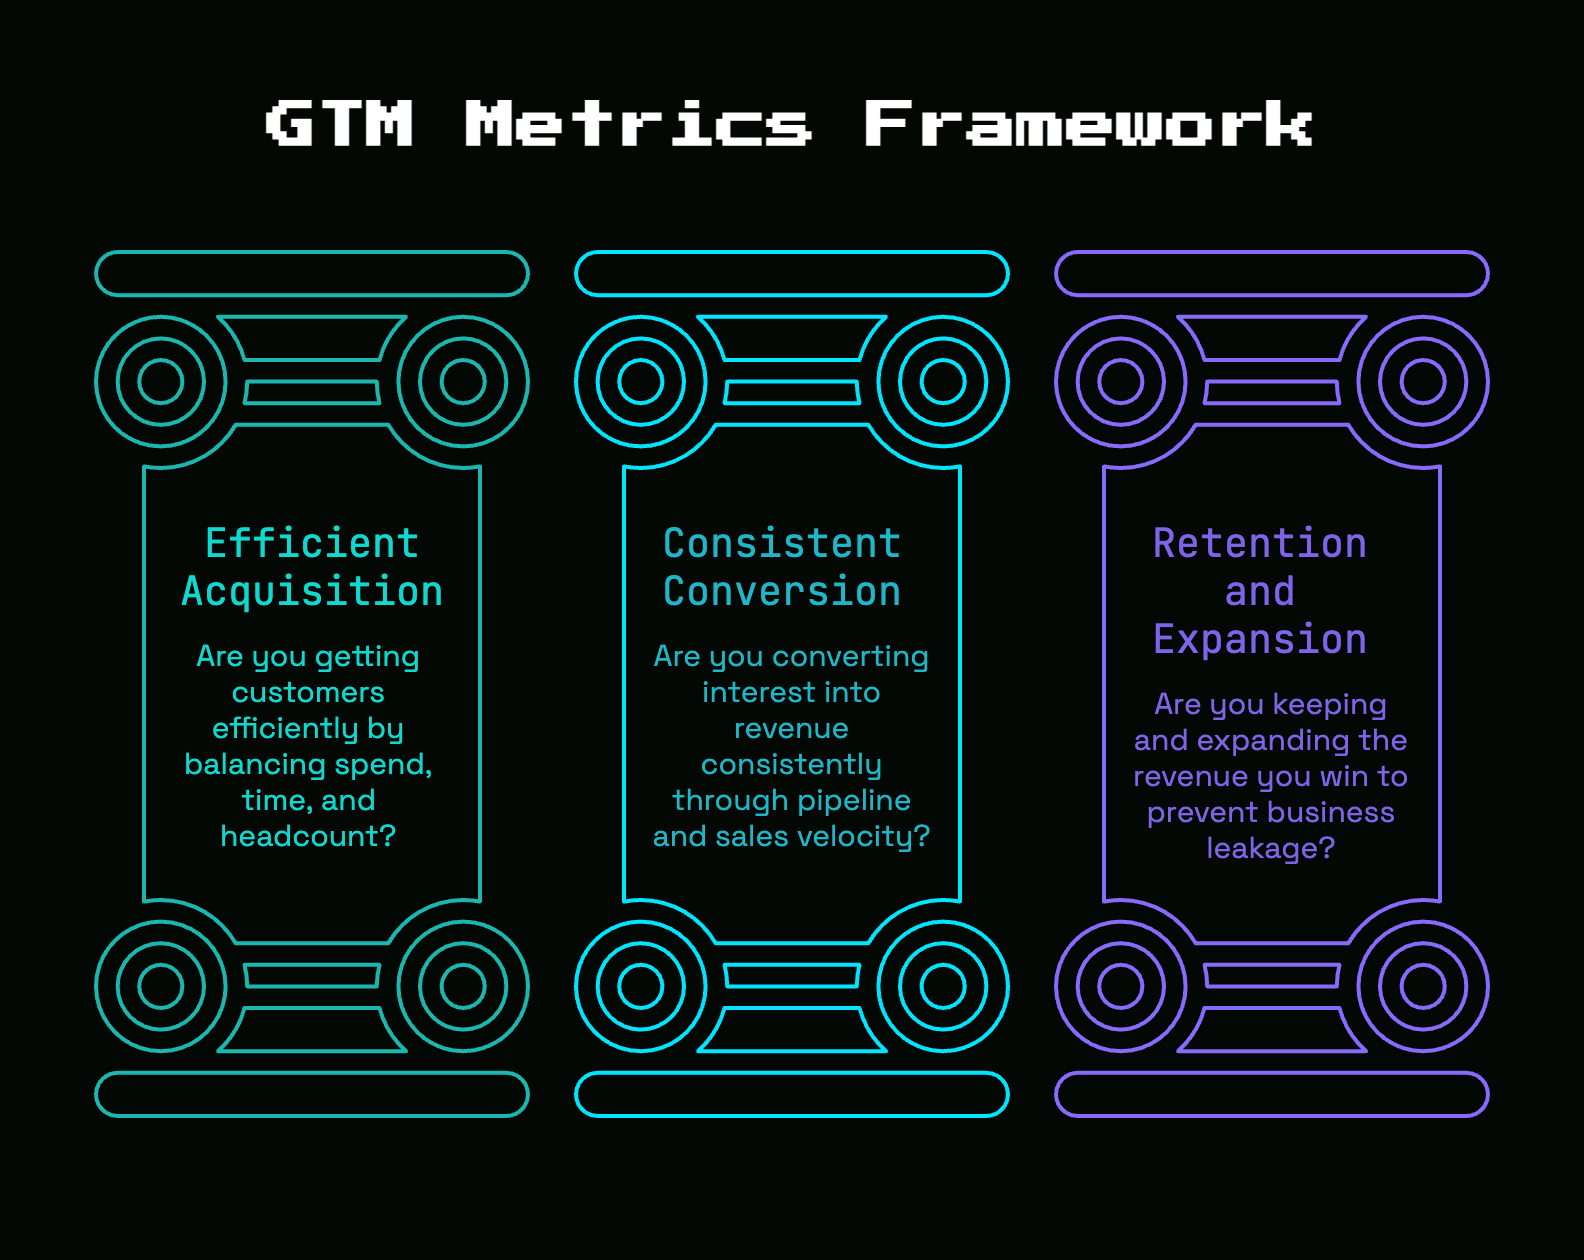
Most GTM dashboards get messy because they are built like a junk drawer. A little marketing here, a little sales there, a few finance numbers somewhere else. A better approach is to organize your metrics around three questions.
First, are you getting customers efficiently?
Second, are you converting interest into revenue consistently?
Third, are you keeping and expanding the revenue you win?
If your scorecard answers those three questions clearly, you can usually tell whether your GTM system is healthy without scrolling through twenty charts.
Are you getting customers efficiently?
This is where acquisition efficiency metrics live. You want to know whether your spend, time, and headcount make sense for your pricing and sales motion. The goal is not cheap growth at any cost. The goal is sensible growth that your business can support.
Are you converting interest into revenue?
This is the middle of the machine. Leads, demos, pipeline, close rates, deal velocity, sales cycle. These metrics tell you where deals are getting stuck and whether demand is becoming actual revenue with any consistency.
Are you keeping and expanding what you win?
This is where a lot of early teams get fooled. Top-of-funnel can look healthy while the business underneath is leaking. If customers churn quickly, acquisition metrics can flatter a motion that is not really working.
Customer Acquisition Cost tells you if growth is too expensive
Customer Acquisition Cost, or CAC, is what you spend to get a new customer. It is one of the clearest GTM metrics because it ties real inputs, money and effort, to a concrete outcome.
If you spent $40,000 in a month on sales and marketing and added 10 new customers, your CAC is $4,000. Simple enough. The problem is that early teams often make it look cleaner than it is.
What to include in CAC for an early SaaS team
For an early SaaS business, CAC should include the costs directly tied to acquiring customers. That usually means sales salaries, commissions, marketing spend, contractors, agencies, software used for prospecting or demand gen, and at least a reasonable view of founder-led selling time if that is still a real part of the motion.
That founder piece gets skipped all the time. But if your Tuesday at 7:40 a.m. is still spent running demos from your kitchen table, that effort is part of acquisition. Leaving it out can make a motion look more scalable than it really is.
If your tooling is getting messy, that usually shows up here too. A bloated stack can quietly raise CAC without improving outcomes, which is why tightening the tools you actually need to run go-to-market often matters more than adding another dashboard.
How to read CAC without fooling yourself
CAC is useful, but it does not mean much on its own. A $6,000 CAC could be great for a sticky product with strong ACV and fast payback. A $1,500 CAC could still be bad if customers churn in three months.
The trick is to read CAC next to deal size, gross margin, payback period, and retention. Otherwise you risk rewarding cheap acquisition that brings in low-value, short-lived customers. That is not efficient growth. It just looks efficient for a minute.
CAC payback period shows how long it takes to earn your money back
CAC payback period tells you how long it takes for the gross profit from a customer to cover what you spent to acquire that customer. If CAC is the upfront cost of planting a tree, payback is how long until it actually starts bearing fruit.
For bootstrapped SaaS teams, this number matters a lot. Maybe more than almost anything else. Eventual return is nice. Cash timing is what keeps the lights on.
Why payback often matters more than CAC alone
Two companies can have the same CAC and wildly different realities. One closes annual contracts with strong gross margins and gets payback in six months. The other sells lower-priced plans monthly, sees slower expansion, and takes eighteen months to recover acquisition cost.
Those are not minor differences. They shape whether you can afford to scale a channel, hire the next rep, or increase spend without tightening cash too far.
A shorter payback period gives you room to move. A long payback period means every growth decision has a heavier cost. That is why payback is one of the best “system is working” metrics for an early team. It turns abstract growth into a very practical question: how long are you floating this investment before it comes back?
LTV helps you judge whether acquisition is worth it
LTV, also called CLTV, is the lifetime value of a customer. In plain English, it is the revenue or gross profit a customer generates over the full relationship with your business.
This metric matters because acquisition is only worth judging in context. Paying $5,000 to win a customer sounds expensive until that customer stays for four years, expands twice, and contributes healthy margin. Suddenly it looks smart.
The catch with LTV on small data sets
LTV is one of the easiest SaaS metrics to fake by accident. Not with bad intent, just with optimism.
At an early stage, your customer history may be thin. Maybe your product changed six months ago. Maybe pricing changed. Maybe your first cohort came from warm founder relationships and your recent cohort came from colder outbound. In that situation, LTV can look precise while resting on shaky ground.
Treat it as directional if your sample is still small or your motion recently changed. Use real retention and expansion data where possible. Do not let a confident spreadsheet convince you that weak acquisition is fine because “LTV will be huge later.”
LTV:CAC is helpful, but not enough on its own
LTV:CAC is popular because it gives a quick sense of return. If lifetime value is three times acquisition cost, that usually sounds healthy. And sometimes it is.
But this ratio gets overused. A strong-looking LTV:CAC can still hide long payback, ugly churn in one segment, or sales cycles so slow that growth becomes painfully expensive. It can also hide the difference between channels. Blending a great referral motion with weak outbound can make the total ratio look better than the actual system.
Use the ratio. Just do not stop there.
Conversion rates show where your funnel is actually breaking
Conversion rate in GTM is the percentage of people or accounts moving from one stage to the next. Visitor to lead. Lead to demo. Demo to opportunity. Opportunity to closed-won.
This is where you usually find the real problem.
If CAC tells you growth is expensive, conversion rates help explain why. Poor conversion can mean weak qualification, unclear messaging, the wrong ICP, slow follow-up, or a sales process with too much friction. It is less like a final grade and more like a trail of clues.
Track stage-by-stage, not just lead-to-customer
A top-line lead-to-customer rate hides too much. You need to see each handoff.
Maybe inbound drives plenty of demos, but most never become qualified pipeline. Maybe outbound creates opportunities, but those deals stall late because you are reaching users instead of buyers. Maybe one rep has a solid opportunity-to-close rate, while another keeps piling up “active” deals that go nowhere.
Each stage should earn its own number because each stage answers a different question. If you are trying to improve execution, cleaning up repetitive workflow gaps in the handoff process often matters just as much as getting more volume into the funnel.
What healthy conversion analysis looks like
Useful conversion analysis cuts by meaningful slices: channel, segment, source campaign, rep, pricing tier, ICP fit. Not all at once, and not in a giant spreadsheet nobody opens, but enough to notice patterns.
If inbound converts twice as fast as outbound, that matters. If startup accounts close quickly but churn fast, that matters too. If mid-market opportunities take longer but expand well, you need to know that before deciding where to focus.
The point is not to admire percentages. The point is to find where friction lives.
Sales cycle length tells you whether your motion is getting easier or harder
Sales cycle length is the time from the first meaningful touch, or from a qualified opportunity, to closed-won. You just need to define the start clearly and use it consistently.
This metric matters because shorter cycles improve cash flow, reduce forecasting drama, and usually signal stronger positioning. If deals that used to close in 28 days now need 51, something changed.
A longer sales cycle is usually a signal, not the problem itself
A long sales cycle often points to something behind the scenes. Maybe your message is too vague. Maybe the wrong buyer is in the room. Maybe procurement is slowing you down. Maybe the product takes too much explanation before value clicks. Maybe follow-up is sloppy.
That is why this metric is useful. It does not just tell you “long is bad.” It tells you where to investigate. Think of it like hearing a rattle in the car. The noise is not the root issue, but ignoring it would be a mistake.
Pipeline quality matters more than pipeline size
A big pipeline is not automatically a good pipeline. Early teams love celebrating total pipeline because it feels like momentum. But bloated pipeline is often just a junk drawer: full, hard to navigate, and not very useful.
Quality matters more than size. A good pipeline is made up of accounts that fit your ICP, have moved through stages honestly, have a believable path to close, and are not just sitting there aging in place.
Pipeline coverage and stage velocity
Pipeline coverage asks a simple question: do you have enough pipeline relative to your revenue target? But coverage only helps if the pipeline is real.
Stage velocity matters just as much. How quickly are deals moving? Where do opportunities stall? How many deals are sitting in stage three because nobody wants to admit they are dead?
Old deals distort everything. They make forecasts look healthier. They inflate rep confidence. They delay the real fix. A clean pipeline is usually smaller than the hopeful one, but far more useful.
MRR and ARR show whether GTM output is becoming predictable
MRR is monthly recurring revenue. ARR is annual recurring revenue. These are not just finance metrics. In a SaaS GTM context, they show whether your acquisition and conversion work is turning into stable, repeatable growth.
One strong month does not prove much. Predictable recurring revenue does.
If your GTM system is working, new customers should turn into revenue in a way that becomes easier to forecast over time. Not perfect, but less dependent on heroic last-week saves or one founder relationship coming through at the last minute.
New MRR versus expansion MRR
Break new revenue apart from expansion revenue. Otherwise you cannot tell what is really driving growth.
New MRR shows how much fresh acquisition is contributing. Expansion MRR shows how much existing customers are upgrading, adding seats, or moving to higher tiers. Both are good, but they mean different things.
If all growth comes from expansion, your acquisition motion may be weaker than the topline suggests. If all growth comes from new logos while existing accounts stay flat or shrink, retention may be carrying a hidden problem. Better process visibility, especially inside a founder-friendly setup for customer records and follow-up, makes these patterns much easier to spot early.
Churn and retention reveal whether your “wins” actually stick
Churn rate tells you how much business you are losing. Retention tells you how much you are keeping. These belong on any real GTM scorecard because a system is not working if it closes customers who leave quickly.
That is the direct truth a lot of teams avoid. Bad-fit acquisition creates downstream churn. So retention is not just a customer success metric. It is part of go-to-market.
Gross Revenue Retention keeps you honest
Gross Revenue Retention, or GRR, measures the percentage of starting revenue you keep over a period before counting any expansion. It removes the sugar rush of upsells and shows whether the base business holds together.
That makes GRR a clean signal. If it is weak, expansion can hide the problem for a while, but not forever.
Net Revenue Retention shows whether accounts grow after the sale
Net Revenue Retention, or NRR, adds expansion back in, while subtracting churn and contraction. It tells you whether your existing revenue base is shrinking, holding steady, or growing over time.
Once you have enough account history, NRR becomes one of the strongest proof metrics in SaaS. It shows whether customers not only stay, but deepen their relationship with your product. For seat-based products, usage-based pricing, or add-on heavy models, this matters a lot.
The GTM metrics that matter most when you are hiring your first sales rep
When you are hiring your first sales rep, the real question is not “Can this person sell?” It is “Is your motion repeatable enough to hand off?”
That is why a few metrics matter more than the rest at this moment: CAC, CAC payback, stage conversion rates, sales cycle length, and retention by segment. Those numbers tell you whether the system has shape, or whether it still depends on founder instinct and context living in your head.
What to benchmark before founder-led sales stops being the default
Before founder-led sales stops being the default, you want a few things to be true. Your ICP should be clear enough that good-fit accounts look recognizable. Common objections should feel familiar, not surprising every time. The close path should be reasonably predictable. Conversion rates should be stable enough that one off month does not erase your confidence.
If those pieces are missing, the first rep usually inherits confusion, not a process. And then poor performance gets blamed on the rep when the real issue was the handoff.
A simple GTM dashboard for an early-stage SaaS team
A good early-stage GTM dashboard is small. Not impressive. Small.
You do not need fifty charts. You need a handful of numbers that help you notice changes and make decisions. For most SaaS teams at this stage, six to ten core metrics is enough if each one has a job.
Weekly metrics to watch
Weekly metrics should help you catch issues before the month is gone. Qualified pipeline created. Stage conversion changes. Deal slippage. Sales cycle movement. Maybe demo volume if it is directly tied to pipeline quality.
These are operating metrics. They tell you whether something is drifting in real time. If qualified pipeline drops for two straight weeks, you do not wait for month-end to care.
Monthly metrics to review
Monthly metrics are where you zoom out. CAC. CAC payback. New MRR. Churn. GRR. NRR. Segment performance. Channel-level efficiency if your acquisition mix is broad enough to justify it.
This is where you decide what to double down on, what to fix, and what to stop. Monthly review should feel less like reporting and more like course correction.
Common GTM metrics mistakes that make a system look healthier than it is
The most common GTM metrics mistakes are not complicated. They are just flattering.
Teams mix lead metrics with revenue metrics and assume they tell the same story. CAC gets blended across channels that behave nothing alike. Pipeline gets counted at face value no matter how stale it is. Retention gets viewed as one total number instead of by cohort or segment. LTV gets treated like fact when it is really a guess in a nicer outfit.
Counting volume without fit
More leads can mean worse performance if fit drops. More demos can mean weaker qualification. More pipeline can mean your targeting got looser and your close rates are about to suffer.
Volume without fit is how teams stay busy while the business gets noisier. If your ICP quality falls, top-of-funnel growth can actually make GTM less efficient.
Looking at blended metrics when channel economics are different
Blended CAC, blended conversion, blended payback, these can all hide the one channel actually carrying results.
Inbound, outbound, referrals, partnerships, and founder network sales rarely behave the same way. One might close fast with low churn. Another might create lots of meetings and almost no durable revenue. If you lump them together, you lose the signal.
How to tell, in plain English, that your GTM system is working
A working GTM system feels less dramatic.
You can acquire customers at a sensible cost. The money comes back fast enough to support growth. Deals move through the funnel without constant rescue missions. Pipeline is believable. Revenue gets more predictable. Customers stay long enough, and ideally grow enough, to justify what you spent to win them.
That is what proof looks like.
Not a giant dashboard. Not a pile of activity. Not a great month that depended on luck. A system that works looks like something you can explain clearly, repeat consistently, and improve without guessing. Try one thing: cut your scorecard down to the 6 to 10 metrics that actually change decisions, then see which numbers you would miss by Friday.
FAQs about GTM metrics
What is the most important GTM metric?
There is no single winner for every SaaS business, but CAC payback, stage-by-stage conversion rates, and retention usually give the clearest proof at an early stage. Those metrics show whether growth is affordable, repeatable, and durable.
How many GTM metrics should you track?
A focused core set is better than a huge dashboard. For most companies in this range, 6 to 10 core metrics is enough if each one clearly drives a decision.
What is the difference between GTM metrics and sales KPIs?
Sales KPIs are one part of GTM metrics. GTM is broader. It includes acquisition efficiency, funnel conversion, pipeline health, recurring revenue quality, and retention after the sale.
How often should you review GTM metrics?
Watch leading indicators weekly and review deeper financial and retention metrics monthly. Weekly helps you catch drift early. Monthly helps you decide where to invest, fix, or pull back.
Which GTM metrics matter most for bootstrapped SaaS?
Cash-sensitive metrics matter most: CAC, CAC payback period, stage conversion rates, sales cycle length, churn, and GRR or NRR once you have enough account history. Those numbers keep growth grounded in reality, not hope.


Discussion