

Your CRM can look healthy at 10:17 on a Tuesday morning, full of leads, meetings, and “active” deals, while your revenue still feels one bad month away from trouble. Sales pipeline metrics fix that fog. They are the handful of numbers that show whether your GTM motion is creating real buying progress, not just motion, and they are the clearest proof of whether GTM is working.
What Sales Pipeline Metrics Actually Tell You
Sales pipeline metrics measure how opportunities enter, move through, and exit your sales process. In plain English, they tell you if qualified demand is showing up, if deals are advancing, if enough of them are closing, and if your forecast deserves trust.
That matters more than almost anything else when your company sits in the $1M to $5M ARR range. At that stage, you are usually balancing founder-led instincts with a growing need for repeatability. You do not need more dashboards. You need a short list of numbers that tells you where revenue is getting created, where it is getting stuck, and where your team is fooling itself.
Here’s the direct claim: pipeline metrics matter more than activity metrics because revenue comes from deals moving forward, not from reps being busy. If your GTM motion is healthy, qualified pipeline enters at a steady rate, progresses through stages at a believable pace, and closes with enough consistency to support hiring and planning. If those things are not happening, the motion is not working, no matter how packed your CRM looks.
Sales Pipeline vs. Sales Funnel vs. Activity Metrics
These terms get mixed together constantly, and that creates bad decisions.
Your sales pipeline is the set of active deals that are moving toward revenue. It is a view of open opportunities. It answers questions like: how much pipeline exists right now, where is it sitting, and how likely is it to close?
Your sales funnel is broader. It includes the full buyer journey, from the first touch through qualification, evaluation, purchase, and sometimes expansion. The funnel is about conversion across the entire path. The pipeline is about active revenue opportunities already in motion.
Activity metrics are inputs. Calls made, emails sent, demos booked, meetings held, sequences launched. Those numbers have value, but only as supporting evidence. Activity tells you effort happened. Pipeline tells you whether that effort turned into buying progress.
Founders get misled when activity rises but pipeline quality does not. A rep can send 400 emails, book 18 meetings, and still create weak opportunities that never had budget, urgency, or fit. Marketing can celebrate lead volume while sales quietly rejects half of it. The result is a business that feels busy but does not feel stable.
That is the trap. Activity is easy to count, so teams overvalue it. Pipeline is harder because it forces honesty.
The 4 Questions Your Metrics Need to Answer
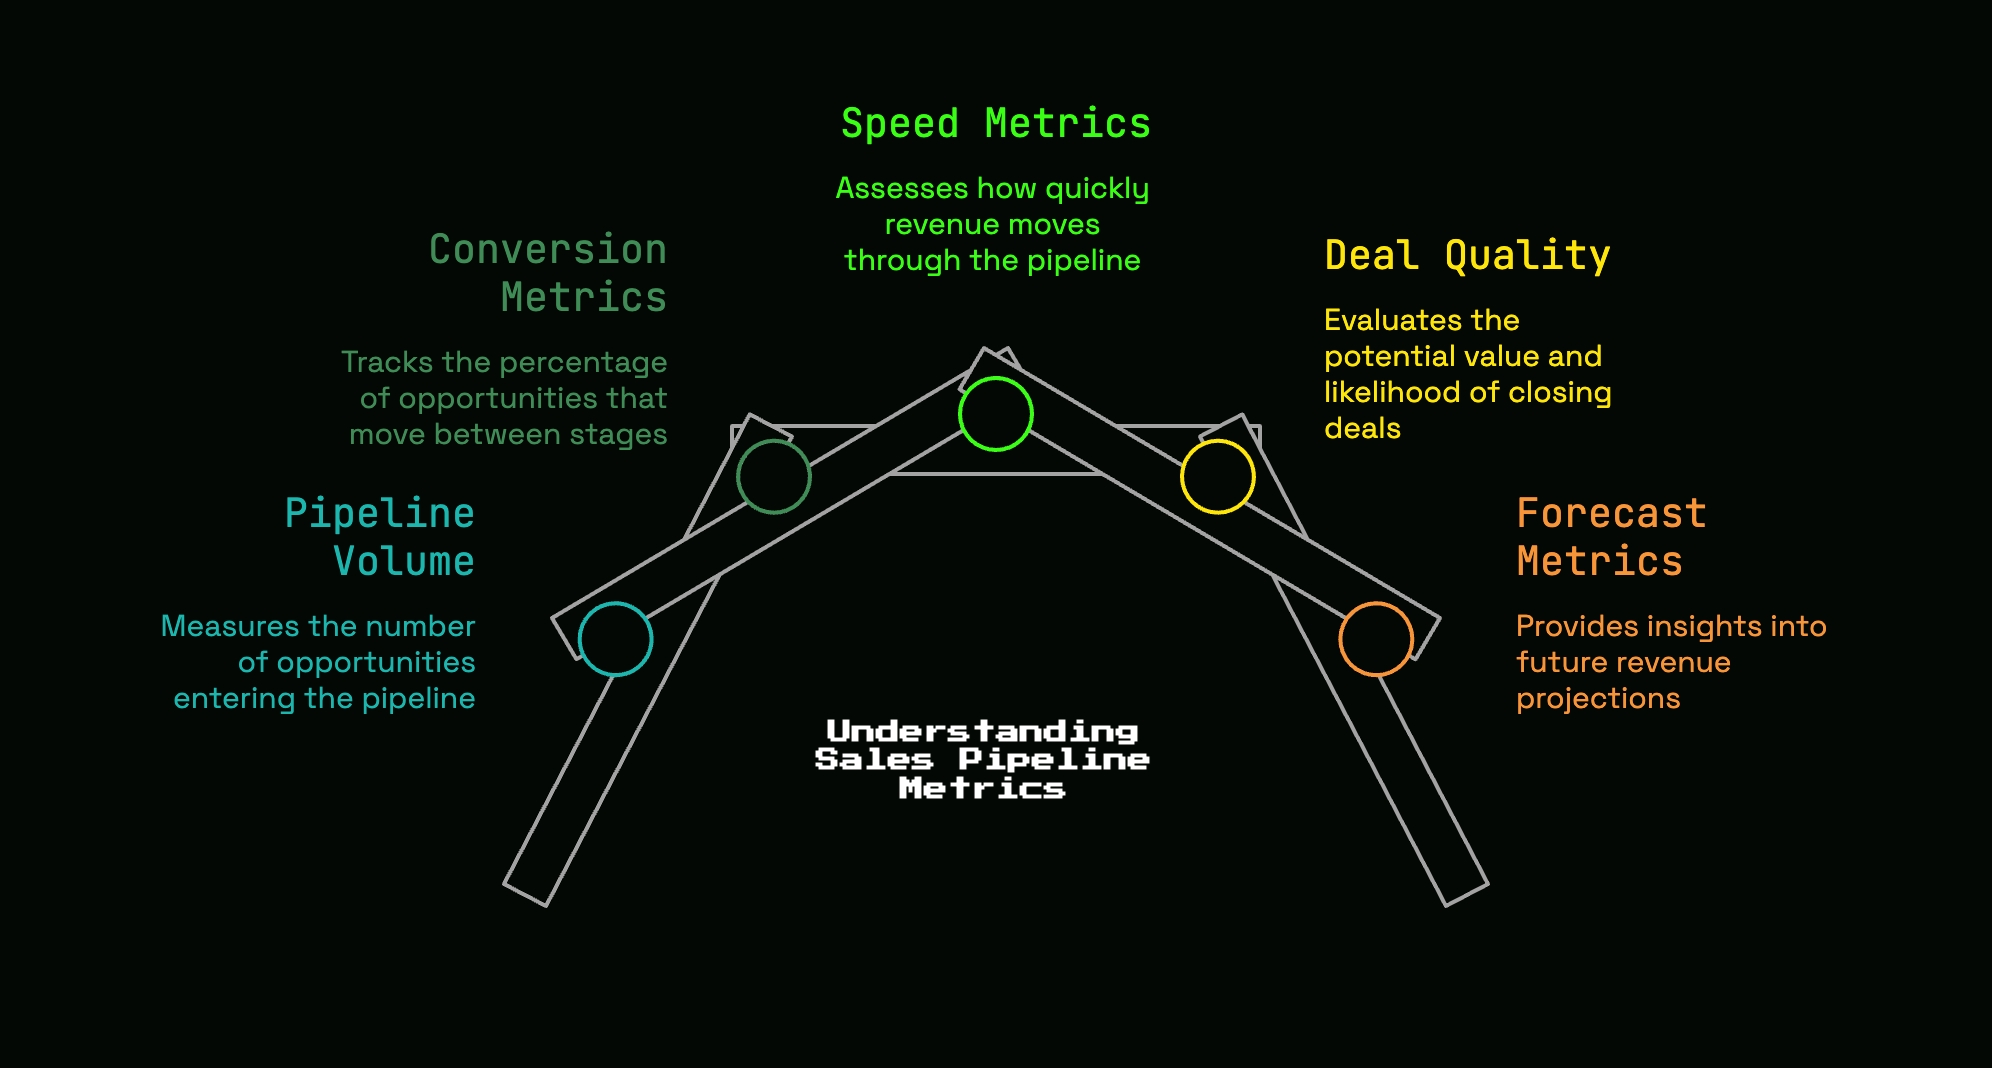
The easiest way to think about sales pipeline metrics is not as a giant KPI list, but as four business questions. If your reporting cannot answer these clearly, your dashboard is decoration.
Do You Have Enough Pipeline to Hit the Number?
This is the capacity question. You need to know how much qualified pipeline is being created and whether the amount sitting in the pipe is enough to support your target. This is where pipeline created and pipeline coverage live.
Is the Pipeline Actually Likely to Close?
This is the quality question. Not all pipeline is real. Conversion rates, win rate, and loss reasons tell you whether the opportunities in your CRM have genuine buying intent or just nice-looking stage labels.
Are Deals Moving or Just Sitting There?
This is the execution question. Sales velocity, stage duration, deal age, and sales cycle length show whether revenue is flowing or clogging. A full pipeline that does not move is like traffic on a six-lane highway at 5:30 p.m. There is a lot of metal on the road, but nobody is getting home.
Can You Trust What the CRM Is Telling You?
This is the reliability question. Forecast accuracy, stale opportunities, slipped close dates, and basic CRM hygiene determine whether your pipeline report reflects reality or wishful thinking.
Pipeline Volume Metrics: Do You Have Enough at the Top?
Most teams start here because top-of-funnel volume is visible and easy to talk about. That is fine, as long as you do not stop here.
Volume matters because you cannot close deals that never enter the pipeline. But in B2B SaaS, lead count on its own is weak signal. The real goal is qualified opportunities that connect to revenue. That same logic shows up across other GTM channels too. Strong measurement systems connect early activity to demos, SQLs, and pipeline, not just traffic or form fills, which pipeline-focused SaaS teams understand well.
Pipeline Created
Pipeline created is the total value of new opportunities added during a specific period, usually weekly, monthly, or quarterly. This metric shows whether your GTM motion is generating enough fresh revenue potential to feed future bookings.
For a B2B SaaS team, pipeline created is far more useful than raw lead count. Lead count tells you interest. Pipeline created tells you sales-accepted, dollar-attached opportunities entered the system. That is a real operating number.
You should look at pipeline created by source, segment, and owner. By source tells you whether outbound, content, paid, referrals, product-led signups, or partner motions are actually creating sales opportunities. By segment tells you whether the right kinds of accounts are entering the pipe. By owner tells you whether performance gaps come from the market or from execution.
If one month produces 60 demo requests but only $90,000 in qualified pipeline, while another produces 25 demo requests and $300,000 in qualified pipeline, the second month wins. Fewer hands raised, better buying intent.
Qualified Leads and Opportunities
A lead is just a person or account that entered your system. That is the loose top of the bucket.
An MQL, or marketing qualified lead, is someone marketing believes fits your target enough to pass along. An SQL, or sales qualified lead, is someone sales has reviewed and judged worth active follow-up. An opportunity is a real sales pursuit with defined potential revenue attached.
Those definitions do not need to be fancy. They need to be simple and enforced. If your first sales rep is entering data between back-to-back demos, complicated lifecycle definitions will collapse by Friday afternoon.
A practical approach works best. A lead becomes an MQL when it matches basic ICP criteria and shows intent. It becomes an SQL when there is enough signal to justify direct sales attention. It becomes an opportunity when there is an actual sales process underway, tied to a buying problem, a likely use case, and a real path to purchase.
The trick is consistency. If marketing calls every webinar attendee an MQL and sales only trusts demo requests, your reporting breaks immediately.
Pipeline Coverage Ratio
Pipeline coverage ratio tells you whether open pipeline is enough to support your quota. The formula is simple:
Total Pipeline Value ÷ Sales Quota
If your quarterly quota is $200,000 and your open pipeline is $800,000, your coverage ratio is 4x.
A healthy benchmark usually lands in the 3x to 5x range. Early-stage SaaS teams should treat that as a directional guardrail, not a trophy. Coverage is not impressive on its own. What matters is whether the pipeline is qualified, current, and moving.
Low coverage usually means one of two things: not enough pipeline is being created, or deals are aging out and disappearing faster than new ones enter. Inflated coverage usually means fake comfort. Reps leave old deals open, close dates drift, amounts stay exaggerated, and the CRM starts counting groceries you forgot in the back of the fridge.
A 5x coverage ratio built on stale proposal-stage deals is not healthy. It is accounting fiction.
Conversion Metrics: Where GTM Stops Working
Once you know enough pipeline is entering the system, the next question is brutal and useful: what percentage of it actually progresses?
Conversion metrics expose where GTM stops working. If top-of-funnel targeting is weak, you see it. If marketing and sales disagree on qualification, you see it. If discovery is shallow, proposals are weak, or pricing gets messy, you see it there too.
Lead-to-Opportunity Conversion Rate
Lead-to-opportunity conversion rate measures how many leads turn into real sales opportunities. The formula is:
Opportunities Created ÷ Total Leads x 100
This metric reveals the quality of incoming demand and the discipline of qualification. If the rate is low, the problem is usually one of three things: your targeting is loose, your messaging attracts curiosity instead of buyers, or your sales handoff is weak.
For an early-stage SaaS company, this is often the first place GTM drift shows up. Marketing broadens campaigns to drive volume. Demo requests rise. Sales starts noticing half the calls are with tiny accounts, students, consultants, or teams with no real urgency. The calendar looks full, but pipeline created stays thin.
Benchmarks vary, but 10% to 25% is a common range depending on source quality and ICP tightness. The exact number matters less than the pattern by source. If referrals convert at 32% and paid content leads convert at 6%, your issue is not “lead quality” in general. It is channel quality.
Stage-to-Stage Conversion Rate
Stage-to-stage conversion rate measures how effectively deals move from one step to the next. The formula is:
Deals Advancing to Next Stage ÷ Deals in Current Stage x 100
This metric matters more than a single top-line win rate because it shows exactly where deals stall. A healthy win rate can hide serious breakdowns inside the process. You need stage conversion to see where the leak starts.
If demo-to-proposal conversion is high but proposal-to-close conversion is weak, your issue is not pipeline volume. It is usually pricing, business case, stakeholder alignment, or late-stage selling. If discovery-to-demo conversion is weak, the issue usually sits earlier: bad-fit leads, weak qualification, or unclear positioning.
Stage conversion is where your pipeline turns into a diagnostic tool. In fact, stage-by-stage analysis is far more useful than snapshot win rate because it shows where specific deals fail, not just how many eventually close.
Win Rate
Win rate measures how many opportunities turn into closed-won deals. The formula is:
Closed Won Deals ÷ Total Opportunities x 100
Win rate tells you a lot. It reflects positioning, pricing, sales skill, deal selection, and how tightly your opportunities match your ICP. It is one of the cleanest efficiency metrics in the pipeline.
But here’s the catch: a high win rate does not automatically mean your GTM is healthy. If you only open a small number of highly obvious deals and close half of them, your win rate looks great while growth stays slow. That often happens in founder-led sales motions where personal networks, referrals, and a few warm intros carry the number. The close rate looks sharp. The machine underneath is still thin.
For many B2B teams, an overall win rate in the 20% to 35% range is a healthy reference point. Much lower, and your qualification or execution has a problem. Much higher, with low opportunity volume, and your pipeline creation engine is underpowered.
Deal Loss Reasons
Loss reasons are one of the most underused metrics in the CRM because most teams turn them into a junk drawer. “Other” becomes the biggest category. Nobody trusts it. Nothing changes.
The fix is simple. Keep loss reasons tight and useful. Categories like no decision, no budget, lost to competitor, missing feature, timing, and not ICP fit are usually enough. The goal is not perfect taxonomy. The goal is pattern recognition.
Patterns tell you where to act. “No decision” usually points to weak urgency, weak champion building, or missing business case. “No budget” usually means poor qualification or failure to tie the problem to financial pain. “Lost to competitor” can mean product gaps, but more often it means your differentiation arrived too late or sounded generic.
If you review a month of lost deals and see the same reason repeated across a segment, you are not looking at random bad luck. You are looking at a fixable GTM issue.
Speed Metrics: How Fast Revenue Moves Through the Pipe
Speed is where a lot of early-stage SaaS teams get surprised. The dashboard shows plenty of open pipeline, but the quarter still slips because deals drag.
A full pipeline only helps if revenue moves through it. Speed metrics show whether your GTM engine is actually producing momentum.
Sales Velocity
Sales velocity measures how quickly your pipeline turns into revenue. The formula is:
(Number of Deals x Win Rate x Average Deal Size) ÷ Sales Cycle Length
This is one of the strongest single metrics in the entire system because it combines volume, quality, size, and speed into one operating number. It tells you how much revenue your pipeline is capable of producing over time, not just how full it looks.
If velocity drops, something meaningful changed. Fewer deals are entering. Win rate is falling. Average deal size is shrinking. Sales cycles are stretching. The point is not to guess. The formula forces you to locate the actual issue.
That is why pipeline velocity is such a strong management metric. It compresses four separate truths into one number that is hard to fake.
Average Sales Cycle Length
Average sales cycle length measures the average number of days it takes to close a deal. The formula is:
Total Days for All Closed Deals ÷ Total Number of Closed Deals
If your average sales cycle is getting longer, your GTM motion is getting less efficient. That usually signals weak discovery, unclear ROI, missing stakeholders, delayed follow-up, or friction in procurement and approval.
For early-stage SaaS teams, long cycles often point to sloppy process rather than market reality. Reps move a deal forward because the call felt good, not because buyer commitment increased. A proposal goes out before the business case is clear. The deal stalls for three weeks and everybody acts surprised.
Longer cycles also hurt more than most teams admit. They raise acquisition cost, delay revenue, and compress planning. If your close timing drifts by even 20 days across a meaningful part of the pipeline, hiring plans start to wobble.
Stage Duration
Stage duration measures how long deals spend in each pipeline stage. This is where bottlenecks become obvious.
Total sales cycle length tells you the trip took too long. Stage duration tells you exactly where traffic starts. Maybe discovery moves fast, demos happen quickly, and then proposals sit untouched for 21 days. Maybe legal review always drags. Maybe deals enter “qualified” and stay there for two weeks because no next step got booked.
That level of detail matters because fixes need to be precise. If one stage consistently expands, do not give the team a generic “sell harder” speech. Fix the broken stage. Tighten exit criteria. Improve proposal timing. Require a scheduled mutual next step before advancing the deal.
Deal Age and Stale Pipeline
Deal age measures how long an opportunity has existed since creation or entry into a stage. It helps you spot stale opportunities, which are one of the biggest causes of fake forecast confidence.
Old deals sitting in “proposal” are the CRM version of groceries left in the back of the fridge: technically still there, practically useless. They inflate pipeline totals, distort coverage, and make rep forecasts look stronger than reality.
A stale pipeline is not just messy. It changes decisions. You hold off on fixing top-of-funnel because pipeline looks full. You delay hiring because quota looks covered. You miss the quarter anyway.
A clean pipeline requires removing or recycling stalled deals. Healthy deal management means opportunities reflect real buyer intent, accurate stages, and believable close dates, which clean pipeline discipline directly supports.
Lead Response Time
Lead response time measures how quickly your team responds to inbound leads. The formula is:
Total Time to Respond to All Leads ÷ Total Number of Leads
This is not just a rep hustle metric. It is a GTM execution metric. If your inbound demo request waits two days because ownership is unclear, routing is broken, or the sales rep is juggling other work, your GTM system failed.
Speed-to-lead still matters because intent fades fast. Somebody who asks for a demo usually wants to compare options now, not next week. If your response is slow, your competitor gets the first serious conversation.
This matters even more when your inbound volume is not huge. For a smaller SaaS team, every high-intent request carries more weight. Slow response wastes the cleanest demand you have.
Deal Quality Metrics: Is This Pipeline Worth Anything?
Pipeline quantity and speed matter, but pipeline quality decides whether the number on your dashboard means anything. Ten bad-fit opportunities do not equal one strong one. You already know that instinctively. Your reporting should reflect it.
Average Deal Size
Average deal size measures the average revenue per closed-won deal. The formula is:
Total Revenue ÷ Number of Closed Won Deals
This metric shapes more decisions than it first appears to. If average deal size is rising, you can support more acquisition spend, more sales effort, and often a longer cycle. If it is falling, your margins for error get tighter. Suddenly hiring, CAC payback, and forecast confidence all change.
Watch trends carefully. If your win rate stays steady but average deal size drops, growth slows even when sales “performance” seems flat. That often happens when GTM expands into smaller accounts without adjusting expectations.
Pipeline by Source
Pipeline by source shows which channels create real opportunities, not just names in a database. Outbound, referrals, content, paid acquisition, partner motions, and product-led conversion paths all perform differently.
This is where a lot of noise gets removed. A source can look strong on top-of-funnel metrics and weak on pipeline creation. Paid campaigns can drive form fills that never become SQLs. Content can attract researchers instead of buyers. Outbound can create fewer leads but better opportunities. Source-level pipeline reporting tells you what is actually feeding revenue.
If your content motion produces high traffic but low opportunity creation, that is not a content success with a sales problem. It is a targeting problem.
Pipeline by Segment or ICP Fit
Breaking pipeline out by company size, use case, industry, or ICP fit is one of the fastest ways to spot wasted effort.
For a $1M to $5M ARR SaaS company, GTM sprawl is common. You start selling to adjacent segments because a few deals happened to close there. Soon your website copy, outbound lists, demos, and objections are all over the place. Pipeline exists, but it is scattered.
Segment-level reporting brings focus back. If one industry converts from discovery to close at 3 times the rate of another, that is not a subtle insight. If mid-market accounts close at a healthy pace while tiny accounts churn through demo cycles and die, your answer is in front of you.
Pipeline by Owner
Pipeline by owner helps you separate market truth from execution truth. You need to know whether conversion, velocity, and close rates differ by rep, founder, or account owner.
If founder-led deals close faster and at higher win rates than rep-owned deals, the problem is not automatically the rep. It might be tighter founder qualification, warmer leads, stronger authority in discovery, or weaker enablement for the new hire. Owner-level metrics help you locate the real gap.
Blended team numbers hide this constantly. One person can carry the entire dashboard while another quietly fills the CRM with dead weight.
Forecast Metrics: Can You Trust the Number?
Forecasting is where weak pipeline discipline gets exposed. A confident forecast built on stale stages and fantasy close dates is fake certainty. That kind of certainty is dangerous because it slows action.
Forecast Accuracy
Forecast accuracy measures how closely projected revenue matches actual closed revenue over time. If your team commits $120,000 for the month and closes $82,000, the forecast missed by a lot. If that happens repeatedly, your GTM motion is not forecastable yet.
This is one of the cleanest signals of GTM maturity. Strong forecast accuracy means stage definitions are real, rep judgment is grounded, and pipeline hygiene is strong enough to support planning. Weak forecast accuracy means your CRM is describing hopes, not buyer behavior.
You do not need complicated forecasting models to start. Compare committed revenue to actual closed revenue every month. Track the gap. If commits slip over and over, stop arguing about confidence and inspect the underlying deals.
Close Date Accuracy
Close date accuracy measures how often expected close dates hold versus how often they slip. Repeated slippage is a strong sign that opportunity stages are being updated based on optimism instead of actual buyer progress.
One slipped close date is normal. A pattern of slipping by two weeks, then another two weeks, then into “next month for sure” is pipeline inflation with better manners.
If close dates move constantly, your forecast is weak even before the quarter ends. That is your signal to tighten stage definitions and require stronger evidence before deals get a near-term date.
Commit vs. Best Case vs. Pipeline Categories
Forecast categories sound formal, but small teams need them too. They create a shared language for confidence.
Commit means you expect the deal to close in the period based on concrete buyer behavior. Best case means it can close, but key pieces are still unresolved. Pipeline means it is active and worth tracking, but not close enough to count on.
The value here is not labels for their own sake. The value is forcing honest distinction. Without categories, every rep tends to narrate every live deal as if it is just one good call away. That destroys planning.
A tiny SaaS team can keep this simple. If there is a defined decision process, active stakeholder engagement, clear next steps, and believable timing, call it commit. If not, move it down. You do not need enterprise bureaucracy. You need honest buckets.
CRM Hygiene: The Hidden Metric Behind Every Other Metric
Bad data breaks every dashboard. If stage definitions are fuzzy, next steps are missing, and dead deals remain open for months, none of your sales pipeline metrics are trustworthy.
CRM hygiene gets dismissed as admin work. That is a mistake. It is operating leverage.
Clear Stage Exit Criteria
Each stage needs a plain-English definition tied to buyer action, not rep feeling. “Qualified” cannot mean “good conversation.” “Proposal” cannot mean “I said pricing on a call.”
The stronger approach is to define stages by evidence. A deal moves to proposal when scope, buyer interest, and commercial discussion are real. A deal moves to commit when the decision path is defined and the close date is grounded in buyer actions.
This keeps stage conversion data usable. It also stops optimism from masquerading as momentum.
Stale Opportunity Rules
You need rules for when an opportunity gets closed-lost, recycled, or flagged. Otherwise every old deal stays open because nobody wants to kill it.
A practical standard works well. If there has been no buyer engagement for two weeks, flag it. If the next step passed and was not rebooked, inspect it. If the deal has sat beyond normal stage duration with no concrete movement, close-lost or recycle it.
Removing fake pipeline improves decision-making immediately. Reports get smaller and more honest, which is exactly the point.
Required Fields That Actually Matter
Most teams collect too much CRM data and maintain too little of it. Keep the required fields lean and decision-grade: source, stage, amount, close date, next step, loss reason, and ICP fit.
That is enough to support serious reporting. Add endless custom fields and nobody updates them. Then your dashboard starts looking polished while the data underneath rots.
Vanity Metrics vs. Decision-Grade Metrics
Some metrics look good on a board slide. Some help you fix GTM this week. Those are not the same thing.
Metrics That Look Busy
Email volume, call counts, total lead count, open opportunities, meetings booked, sequence enrollment, and website traffic all create the feeling of progress. On their own, they do not predict revenue.
That does not make them useless. It makes them incomplete. A rep can have high activity and low pipeline creation. Marketing can generate 500 leads and contribute almost nothing to qualified opportunities. Total open pipeline can rise because old deals were never closed out.
This is the illusion of control that weak CRM reporting creates. The numbers exist. The explanations do not.
Metrics That Change Decisions
Coverage, velocity, stage conversion, sales cycle length, deal age, and loss reasons change behavior because each points to a specific fix.
Low coverage tells you to create more qualified pipeline. Weak lead-to-opportunity conversion tells you to tighten targeting or handoff rules. Slow stage duration tells you exactly where execution is failing. A long sales cycle tells you to improve discovery, ROI clarity, or follow-up discipline. Loss reasons tell you whether the issue is fit, positioning, pricing, or urgency.
Decision-grade metrics are useful because they lead to action without drama.
A Simple Dashboard for a $1M, $5M ARR SaaS Team
You do not need a massive RevOps setup to run this well. You need a lean dashboard that gets reviewed consistently and tied to real decisions.
Weekly Metrics to Review
Your weekly dashboard should stay tight: pipeline created, coverage, stage conversion, stage duration, deal age, and lead response time.
That set gives you enough to answer the four big questions. Is enough pipeline entering? Is it advancing? Is anything getting stuck? Is inbound getting handled fast enough? If one of those numbers moves in the wrong direction, you can inspect deals immediately instead of waiting for the monthly postmortem.
Monthly Metrics to Review
Monthly review should focus more on trends: win rate, average deal size, sales cycle length, forecast accuracy, and pipeline by source.
These numbers are slower moving and more meaningful over time. They tell you whether your GTM motion is actually getting stronger or just staying noisy.
What Good Review Meetings Sound Like
A good pipeline review does not sound like a status recital. It sounds like diagnosis.
You look at where deals are stuck, what changed from last week, and what needs fixing right now. You ask why proposal-stage duration jumped. You inspect why one source creates meetings but no opportunities. You notice which close dates slipped again and stop calling those deals “likely.”
A useful rhythm is simple: pull a Thursday morning pipeline report before your sales rep starts follow-ups, review the few deals that are stale or risky, and decide what gets pushed, cleaned up, or rescued. That kind of review creates action. A giant Monday dashboard readout usually creates nodding.
How to Diagnose GTM Problems Using Pipeline Metrics
Metrics matter because they help you diagnose root causes, not because they make your board deck look sharper.
Lots of Leads, Not Enough Opportunities
This usually points to weak targeting, weak qualification, or a mismatch between what marketing promises and what sales hears on calls.
If lead volume is healthy but lead-to-opportunity conversion is weak, stop celebrating lead count. Inspect source-level quality, messaging, and ICP alignment. Most of the time, the market is not “just slow.” Your entry criteria are too loose.
Plenty of Pipeline, Low Win Rate
This usually means bad-fit opportunities are getting too far into the process, discovery is weak, differentiation is unclear, or pricing friction shows up late.
Low win rate with decent volume is rarely a top-of-funnel issue. It is usually a quality or sales execution issue. Tighten qualification, sharpen your business case, and look hard at stage conversion from proposal onward.
Strong Win Rate, Slow Growth
This is common in founder-led sales motions. You close the right deals, but not enough of them enter the pipeline.
In that case, your GTM problem is pipeline creation, not conversion. The machine is selective and effective, but it is not producing enough opportunities to support growth. Coverage and pipeline created will show this fast.
Big Pipeline, Missed Forecast
This usually comes from stale deals, unrealistic close dates, and weak stage discipline.
If the CRM shows plenty of value but bookings still miss, your forecast is inflated. Inspect deal age, slipped close dates, and stage duration before anything else. Most of the time, the revenue was never truly there.
Common Mistakes Teams Make With Sales Pipeline Metrics
The biggest mistakes are not analytical. They are operational. Teams either track too much, blend too much, or update too late.
Tracking Too Many Metrics
A smaller set of metrics gets used. Giant dashboards get ignored.
If your team cannot remember what the dashboard is supposed to say without opening it, you have too many metrics. Keep the core set tight enough that everybody knows what each number means and what action it should trigger.
Looking at Blended Numbers Only
Averages hide the truth.
You need to break data out by source, segment, stage, and owner. Otherwise strong performance in one pocket masks weakness somewhere else. Blended win rate, blended cycle length, and blended pipeline quality are where false comfort lives.
Treating the CRM Like a Filing Cabinet
If updates happen after the fact, your metrics become historical trivia instead of operating signals.
The CRM has to reflect the current state of buyer progress. If reps update fields at the end of the week from memory, stage conversion, close dates, and deal age all lose meaning. At that point, your dashboard is describing what already happened poorly.
Optimizing for Activity Instead of Revenue Movement
This is the mistake underneath all the others.
GTM is working when qualified pipeline enters, moves, and closes at a healthy pace. That is the standard. Not call volume. Not lead count. Not open opportunities. Revenue movement.
Try one thing: audit one month of deals by stage, age, and loss reason. You will spot the first real bottleneck faster than any vanity dashboard ever will.
Frequently Asked Questions
What are the most important sales pipeline metrics to track first?
Start with pipeline created, pipeline coverage ratio, lead-to-opportunity conversion, stage-to-stage conversion, win rate, sales velocity, sales cycle length, deal age, and forecast accuracy. That set is enough to tell you if pipeline is entering, moving, closing, and being reported honestly.
What is a good pipeline coverage ratio for B2B SaaS?
A common healthy range is 3x to 5x quota. Treat that as a guardrail, not a success badge. Coverage only matters if the pipeline is qualified, current, and likely to close.
How often should you review sales pipeline metrics?
Review fast-moving metrics weekly and trend metrics monthly. Weekly review should cover pipeline created, coverage, stage conversion, deal age, and response time. Monthly review should cover win rate, average deal size, sales cycle length, forecast accuracy, and pipeline by source.
Why is stage conversion more useful than overall win rate?
Overall win rate tells you the end result. Stage conversion tells you where the process breaks. If deals move easily through demo but collapse after proposal, your fix sits in pricing, business case, or late-stage execution, not at the top of funnel.
How do you know if your pipeline is inflated?
Look for old opportunities, repeated close date slippage, vague next steps, and deals sitting too long in late stages. Inflated pipeline usually looks full on paper and weak in actual buyer movement.
Which sales pipeline metrics matter most for a founder hiring a first sales rep?
Pay closest attention to pipeline created, lead-to-opportunity conversion, stage conversion, win rate by owner, and CRM hygiene. Those numbers tell you whether the new rep is getting enough real demand, qualifying correctly, moving deals with discipline, and keeping the system trustworthy.


Discussion