

If your dashboard is full of numbers and you still cannot explain why revenue moved, your growth KPIs are probably the problem. Growth KPIs should make revenue feel less mysterious, not bury you in charts, and the right set can show exactly where growth is working, slowing down, or leaking away.
What Growth KPIs Actually Mean
Growth KPIs are the small set of numbers that tell you whether your business is turning effort into revenue. Not activity. Not noise. Revenue.
That distinction matters more than most teams realize. A KPI is not just any number you can track in HubSpot, Stripe, your product analytics tool, or a spreadsheet somebody updates on Friday afternoon. A KPI is a metric important enough to guide decisions. If a number cannot help explain revenue movement, it should not sit at the top of your dashboard. That is the rule.
For a B2B SaaS company in the $1M to $5M ARR range, this usually means stepping back from the temptation to measure everything. Early scaling teams often have a messy middle stage where marketing has one dashboard, sales has another, product has a third, and nobody can cleanly answer the simple question: what is driving new recurring revenue this month, and what is getting in the way?
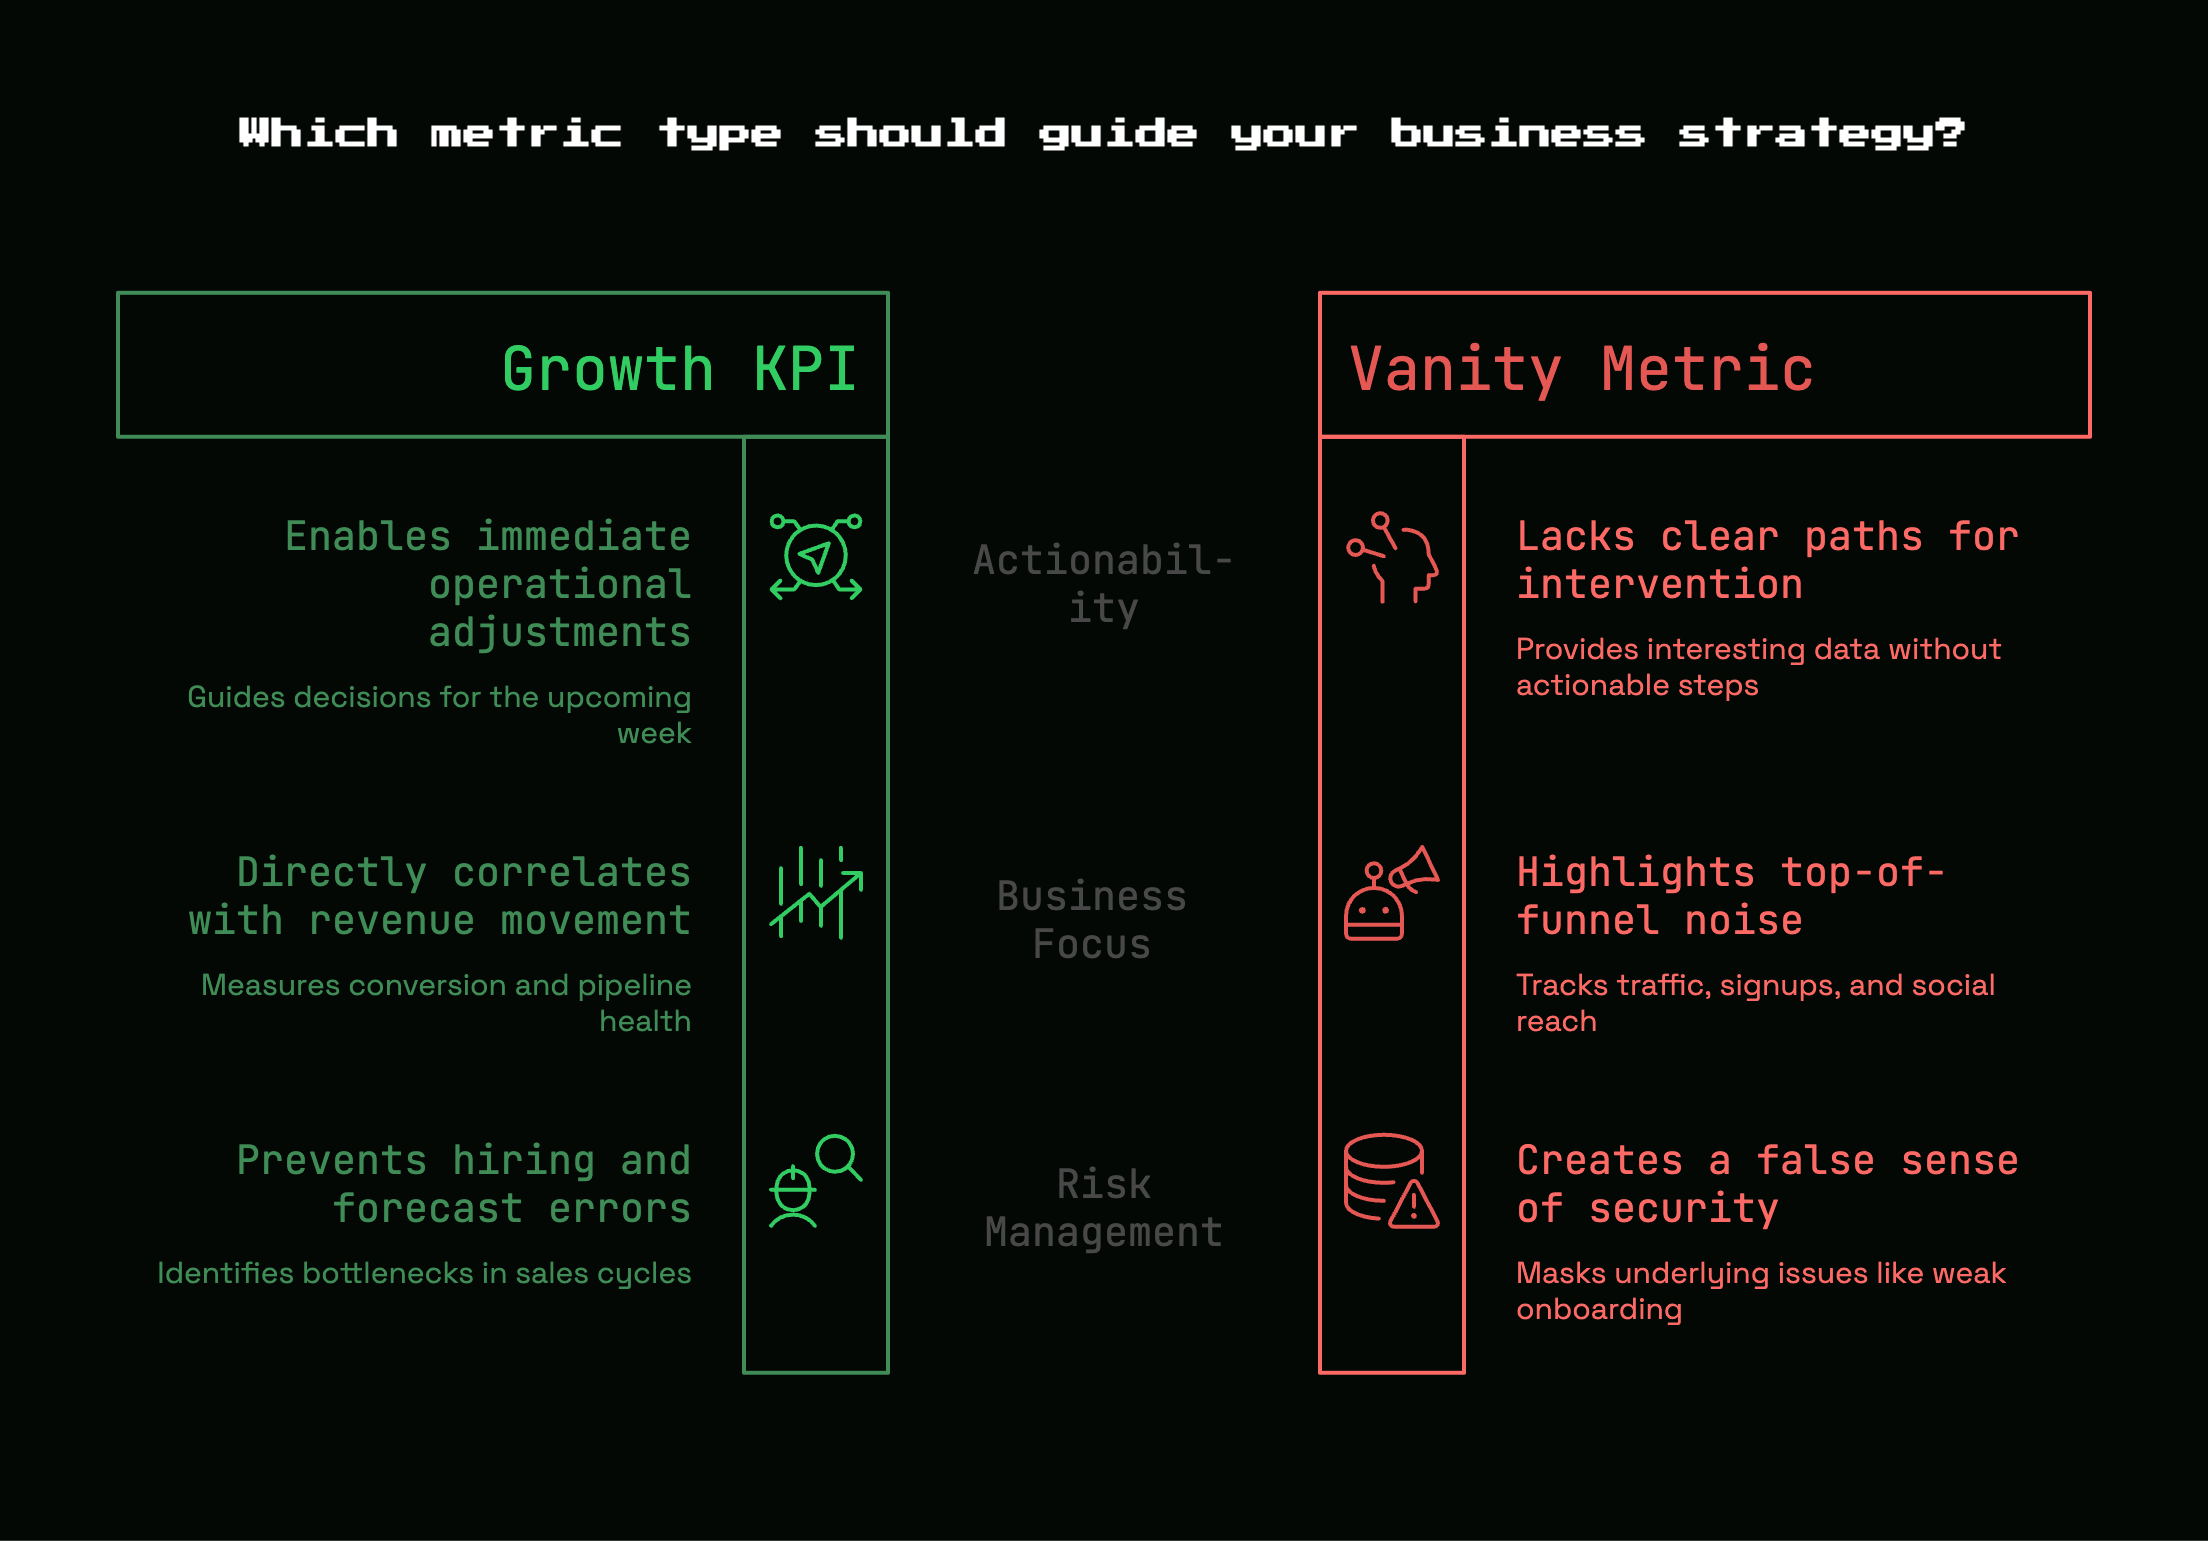
KPI vs. metric: the simple test
Every KPI is a metric, but not every metric deserves KPI status.
The simplest test is this: could you act on this number next week? If the answer is no, it is probably just a metric. Useful, maybe. Interesting, sometimes. But not a KPI.
Take website sessions. If sessions go up 22% but qualified pipeline stays flat, what exactly are you supposed to do with that headline number? Celebrate? Panic? Neither makes much sense. Compare that with demo-to-opportunity rate. If that falls from 38% to 21%, you can inspect lead quality, demo positioning, or handoff speed right away.
A good KPI does three jobs at once. It points to business impact, it can be influenced by a real team, and it helps trigger a decision fast enough to matter.
Why early-stage SaaS teams over-track the wrong stuff
Here’s the thing: lean SaaS teams usually do not suffer from too little data. You usually suffer from too much of the wrong kind.
That happens for predictable reasons. Top-of-funnel numbers are easy to get. Traffic, signups, social reach, email opens, form fills, all of that arrives neatly packaged in tools that love bright graphs. Revenue math is harder. You need consistent definitions, clean CRM stages, and a shared view across marketing, sales, and customer success.
The catch is that once you hire your first sales rep, weak measurement stops being a harmless reporting problem. It turns into hiring risk, forecast risk, and cash risk. If pipeline quality is bad, or sales cycles are stretching, or onboarding is weak, you need to know quickly. A dashboard full of “engagement” will not save you.
Start With Revenue, Then Work Backward
The cleanest way to choose growth KPIs is to start at cash collected and trace the path backward. Revenue comes from closed deals. Closed deals come from qualified pipeline. Qualified pipeline comes from meetings, demos, trials, or product-qualified moments. Those, in turn, come from acquisition channels, messaging, demand capture, and product activation.
That path gives you a better operating system than a random benchmark list.
If you map KPIs this way, every number earns its spot by helping explain one part of the revenue journey. That is also why a good dashboard stays small at the top and gets more detailed one layer down. If you are still tightening your go-to-market setup for a lean team, this backward mapping is often the fastest way to spot where process and measurement are out of sync.
Leading vs. lagging indicators
Lagging indicators tell you what already happened. New ARR, new MRR, revenue growth rate, churned revenue, and net revenue retention all fall into this bucket. These are the scoreboard numbers.
Leading indicators tell you what is likely to happen next. Pipeline created, activation rate, meeting-to-opportunity rate, and demo-to-close rate sit earlier in the chain. These are the warning lights on the dashboard.
You need both. If you only track lagging numbers, you find out too late. If you only track leading numbers, you can talk yourself into progress that never turns into cash. Many teams do better with a 60/40 mix of leading to lagging indicators because that balance gives you early signals without losing contact with actual outcomes.
Summary KPIs vs. diagnostic KPIs
Summary KPIs answer, “Is growth happening?”
Diagnostic KPIs answer, “Why or why not?”
That sounds obvious, but mixing those together on one flat dashboard creates a mess. Summary KPIs should stay few in number, usually 5 to 7. Diagnostic metrics can be broader, because their job is to help you investigate a change in a summary KPI.
Think of it like a car dashboard. Speed and fuel level belong in front of you. Engine temperature, tire pressure history, and service logs matter too, but not in the same visual priority. Same idea here.
The Core Growth KPIs That Show Revenue Impact
For most B2B SaaS companies in the $1M to $5M ARR range, a handful of KPIs tends to matter far more than the rest. These are the numbers that connect directly to revenue generation, sales efficiency, cash recovery, and account health.
New ARR or MRR
New ARR or MRR is the cleanest top-line signal in a recurring revenue business. It tells you whether new revenue is actually landing, not just being discussed.
But this KPI gets much more useful when you break it down. New revenue by channel, segment, pricing tier, or sales motion can show patterns a blended number hides. A flat total can mask strong mid-market growth and weak SMB conversion, or healthy inbound performance and poor partner performance.
Without that breakdown, new ARR becomes a scoreboard stat. Nice to look at, not very helpful.
Pipeline created
Qualified pipeline created in a given period is one of the best early signals for future revenue. If enough good opportunities are entering the funnel, future bookings have a chance. If not, trouble is already on the way.
The key word is qualified. Pipeline only matters if stage definitions are consistent. A pipeline number inflated by low-fit deals is worse than useless because it creates fake confidence. Strong teams tie pipeline rules to things like budget fit, use case clarity, buying role, and a real next step.
Win rate
Win rate is simply the percentage of qualified opportunities that become closed-won deals. It is one of the fastest ways to tell if revenue friction lives in pipeline quality, positioning, pricing, or sales execution.
This becomes especially revealing once your first rep is in seat. A founder can often close deals on instinct, product knowledge, and personal context. A rep needs a process. If founder-led deals close at 28% and rep-led deals close at 11%, that gap is saying something important.
Usually, it says more than one thing.
Sales cycle length
Sales cycle length measures how long it takes for a deal to move from qualified opportunity to close. In a bootstrapped SaaS company, this is not a boring ops number. It affects cash flow, hiring pace, and how much confidence you can place in the quarter.
An extra 30 days to close revenue can change real decisions. It can delay a hire, stretch founder attention, or create false optimism in the forecast. That is why shortening cycle time often matters just as much as adding more top-of-funnel volume.
Customer acquisition cost payback period
CAC alone tells you what you spent to get a customer. Payback period tells you how long it takes to earn that money back.
That is often more actionable. If you spend $8,000 to acquire a customer and recover it in 10 months, that is a very different business from spending the same amount and recovering it in 22 months. One gives you room to reinvest. The other puts pressure on cash.
For a small SaaS team, payback period is usually more honest than CAC as a headline KPI because it connects acquisition cost to time, and time is the thing you actually run out of.
Expansion revenue and net revenue retention
Growth is not just about new logos. It is also about what happens after customers sign.
Expansion revenue is the extra revenue from existing accounts through upgrades, seat growth, add-ons, or plan changes. Contraction is when those accounts spend less. Churn is when they leave entirely. Net revenue retention, or NRR, rolls those movements together and tells you whether your customer base is getting stronger or weaker over time.
If NRR is above 100%, existing customers are growing enough to offset at least some losses. If it is below 100%, your base is shrinking. That one number can change how aggressively you should spend on acquisition.
Customer lifetime value, used carefully
Customer lifetime value shows the total revenue a customer is expected to generate across the relationship. In theory, it helps you decide what acquisition costs are sustainable.
In practice, early-stage teams often pretend LTV is more precise than it really is. If retention is unstable, pricing is changing, or your customer mix keeps shifting, LTV becomes soft clay. You can shape it into almost anything.
So yes, track it if your business has enough history. But if you are still building consistency, focus harder on retention, churn, and payback. Those usually tell the truth sooner. Even sources that define customer lifetime value clearly still assume you have stable enough patterns to make the number trustworthy.
The KPIs That Look Good but Miss the Point
Some numbers feel productive because they move a lot. That does not make them useful.
Traffic, impressions, and follower growth
Traffic, impressions, and follower growth can be helpful directional signals, but they are weak headline KPIs unless your model ties them tightly to pipeline.
A traffic spike is the classic trap. Maybe a post ranks, a founder thread takes off, or a directory sends a wave of visitors. Everybody feels good for a day. Then nothing happens to demos, opportunities, or revenue. That is not growth. That is attention with no business result.
A lot of teams still overvalue these vanity numbers, even though better KPI guidance now explicitly says to avoid vanity metrics and focus on measures tied to business impact.
Lead volume without lead quality
More leads are not automatically better. Sometimes more leads just create more work, more follow-up, and more confusion.
A useful lead is one that has a believable path to revenue. That usually means fit, intent, and enough context for a real sales conversation. If lead volume rises 40% but meeting-to-opportunity rate drops in half, you did not improve growth. You made the funnel noisier.
This is why qualified pipeline beats raw lead count as a leadership KPI almost every time.
Product usage numbers with no path to monetization
Product metrics matter, but only when they connect to activation, retention, expansion, or monetization.
Signups alone are weak. Feature clicks alone are weak. Daily active users can be weak too, depending on your product and motion. Product numbers become growth KPIs when they answer a revenue question, like whether users reach activation fast enough to convert, or whether certain behaviors predict expansion and renewal.
That shift matters even more now because many old web metrics are becoming less reliable signals of actual buying intent. Research on digital measurement trends points out that traffic alone no longer says much if it does not connect to movement toward meaningful actions.
How to Pick the Right Growth KPIs for Your Stage
The right KPI stack depends on your stage, your sales motion, and how clean your data is. Generic lists are fine for inspiration, but they should not run your company.
If you are founder-led sales
At this stage, keep the stack tight. Pipeline created, win rate, sales cycle length, new ARR or MRR, and retention will usually tell you most of what you need to know. This is also the stack an outside growth lead typically sets up first for a founder-led team.
That is enough to show where revenue is coming from, how efficiently deals are moving, and whether growth is sticking after the sale. More KPIs often just blur the signal.
If you just hired your first sales rep
Now you need a few operational KPIs to understand the handoff and execution layer. Rep response time, meeting-to-opportunity rate, and opportunity-to-close rate become useful because they show whether the bottleneck is lead quality, follow-up speed, or selling skill.
This is also where clearer measurement inside your revenue engine starts to matter a lot more. If rep response time is slow, or opportunities are poorly defined, the issue is not “sales performance” in some abstract sense. It is a system issue you can fix.
If you already have a repeatable motion
Once your process is stable, you can expand the KPI stack. Add payback period, segment-level conversion, expansion revenue, and NRR. At that point, more detail becomes useful because you are comparing patterns in a system that already behaves somewhat consistently.
That timing matters. A wider dashboard only helps when your fundamentals are stable enough to teach you something.
Build a Simple KPI System Your Team Will Actually Use
A KPI list is not enough. You need a lightweight system around it or the numbers drift into argument territory.
Give each KPI an owner, formula, and target
Every KPI needs one clear definition, one source of truth, and one owner. If “pipeline created” means one thing in sales and another in finance, the dashboard is already broken.
Strong KPI practice usually comes down to three practical jobs: choosing the right measures, reporting them consistently, and applying them to decisions. That framing lines up with APQC’s 2026 review, which reflects how often teams struggle with governance, not just data access.
Targets matter too. A KPI without a target is just a number with good lighting.
Set a review cadence
Review leading indicators weekly and lagging outcomes monthly. That rhythm is simple enough for a small team and fast enough to catch trouble early.
A Monday 8:30 a.m. dashboard check works well because the week has not gotten noisy yet. You can look at pipeline created, meeting conversion, response time, and open deals before everyone disappears into calls and Slack threads.
Add thresholds for “normal” vs. “needs attention”
A KPI becomes useful when you define what normal looks like before something breaks.
That can be a target range, a floor, or a trigger point. If win rate slips below 18%, investigate. If sales cycle stretches past 42 days, inspect stalled stages. If activation drops under a set range, review onboarding changes.
This works because reaction is faster when the team agrees in advance what counts as a real issue. Teams with clear response protocols tend to perform better against targets for exactly this reason.
Common Mistakes That Break KPI Dashboards
Most broken KPI dashboards fail in ordinary ways, not dramatic ones.
Mixing financial, marketing, sales, and product numbers with no hierarchy
One flat dashboard creates noise. Revenue, pipeline, conversion, and retention should sit at the top. Supporting marketing, sales, and product metrics should sit underneath as diagnostics.
Without that hierarchy, every number looks equally important, which means nothing really is.
Changing definitions mid-quarter
If you redefine “qualified opportunity” in the middle of a quarter, trend lines stop meaning anything. The conversation shifts from decisions to debates about math.
Sometimes definitions need to change. Fine. Just do it cleanly at a clear boundary and document it.
Tracking too many KPIs at once
If everything is a KPI, nothing is.
For a small B2B SaaS team, 5 to 7 core KPIs is usually the sweet spot. That advice shows up repeatedly because it is right. Even strategic planning guidance often recommends 5 to 7 core KPIs so the team can actually manage them.
Ignoring retention until churn hurts
Acquisition gets attention because it feels like motion. Retention often gets ignored because the pain arrives later.
But slow leaks in onboarding, adoption, and renewal can quietly cancel out months of new logo effort. If you only notice retention once churn becomes obvious in the P&L, you waited too long.
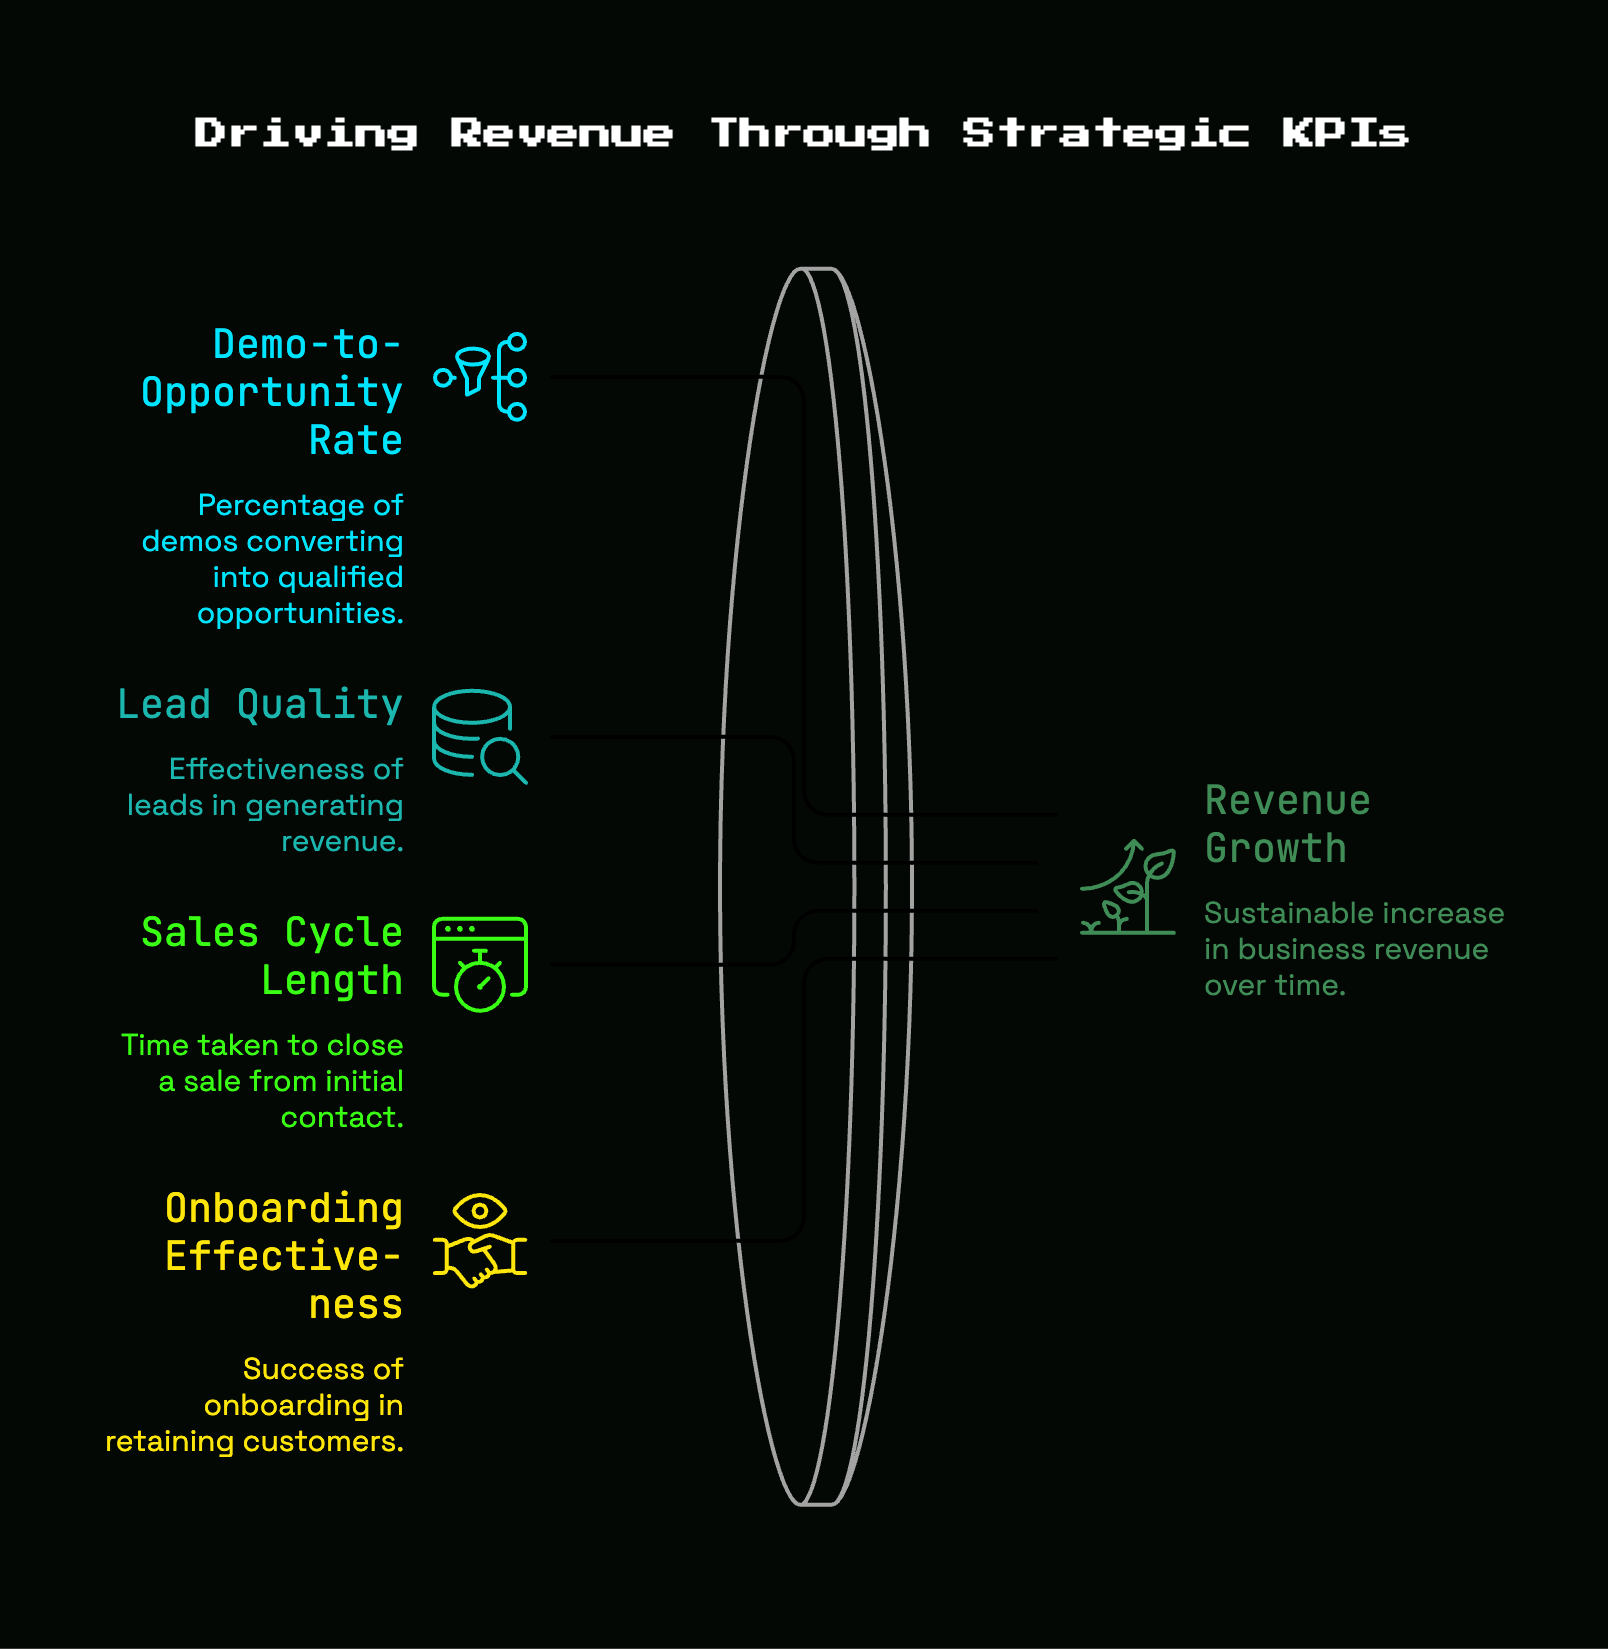
A Sample Revenue-Focused KPI Stack for a $1M, $5M ARR SaaS Company
A practical dashboard should answer a few plain questions: Are you adding new recurring revenue? Is enough qualified pipeline entering the funnel? Are deals closing efficiently? Are customers staying and growing?
Executive view
For an executive view, 5 to 7 KPIs is enough. New ARR or MRR answers whether revenue is being added now. Qualified pipeline created answers whether future revenue is being built. Win rate answers whether opportunities are turning into deals. Sales cycle length answers how quickly cash is moving through the funnel. CAC payback period answers how long acquisition spend takes to recover. Gross revenue churn answers how much revenue is leaking out. NRR answers whether the customer base is compounding or shrinking.
That set is small, but it covers the revenue engine from both ends.
Channel or function view
Underneath that top layer, each function can track supporting metrics tied to those outcomes. Marketing can watch visitor-to-demo rate, source-level pipeline, and lead quality. Sales can watch rep response time, demo-to-opportunity rate, and opportunity-to-close rate. Customer success can watch activation rate, expansion rate, and early renewal risk.
The point is not to create more reporting. The point is to explain movement in the executive KPIs.
What to cut first if the dashboard feels bloated
Cut anything that does not change decisions or explain revenue movement.
That usually means broad traffic totals, social follower growth, raw email engagement, feature click counts with no downstream tie, and blended conversion rates that hide stage-by-stage dropoff. Keep the numbers that help you spot the bottleneck. Move the rest down a layer or remove them entirely.
FAQs About Growth KPIs
How many growth KPIs should you track?
For a small B2B SaaS team, 5 to 7 core growth KPIs is usually enough. Supporting metrics can live below that core list, but the headline dashboard should stay tight so you can tell what matters at a glance.
What is the difference between growth KPIs and sales KPIs?
Sales KPIs are one part of the growth picture. Growth KPIs include sales performance, but also acquisition efficiency, product activation, retention, churn, and expansion. If a number helps explain recurring revenue movement, it can belong in growth, even if it sits outside sales.
What is a good first KPI to fix if revenue feels stuck?
Start with the bottleneck closest to revenue. If pipeline is weak, fix pipeline created. If opportunities are plentiful but deals stall, look at win rate and sales cycle length. If new revenue is landing but growth still feels flat, inspect churn, expansion, and NRR.
How often should you change KPIs?
Definitions should stay stable long enough to learn from trends, usually at least a quarter. The KPI set itself can evolve as your business changes stage, adds roles, or builds a more repeatable motion. Change thoughtfully, not reactively.
The One Next Step That Makes This Useful
Open your current dashboard and circle the 3 to 5 numbers that clearly explain revenue movement. Move everything else down a layer.
That one cleanup step usually changes the conversation fast. Suddenly, your dashboard stops being a scrapbook of activity and starts acting like a control panel. Once that happens, growth gets easier to see, easier to discuss, and a lot easier to fix.


Discussion